I realized that I hadn't ever posted anything about work. Bummer. Or maybe not. It's very twisted, my work.
My original boss left for something stable (and bully on him, because he's got needs -- like wanting a life finally). The boss I was supposed to have (nobody told me I was reporting to him, but he was VP of Engineering, so I figured he was next in chain of command) was laid off today. Oh yeah, he was also a founder of the company. And he's known everyone -- personally -- at work for years. But that doesn't matter. My new boss is taking it all in stride. Which is good since he used to live with my original boss, but is now renting a house from my old boss. If that sounds weird to you I can explain: it's weird. We have more soap opera before 11 am than most companies have all year.
I'm not sure how I'm taking it. I've been there 11 months and we've had 5 rounds of layoffs. I'm amazed I'm still employed. And I'm always wondering how bad it has to get to make me a debit column on a spreadsheet.
Best to have more than one iron in the fire, I think...
It's banner news day today. OK, I confess: I'm out sick from work and the decongestant I took is making me alternately bored of everything and intensely interested in the minutest of things. Tired but not able to sleep. You get the idea.
Anywa, if you're having troubles getting wireless networking going on a laptop (and you have a Lucent 802.11b card), try an app called KOrinoco.
I was fooling with networking last night and was having kind of a hard time. There's three ways to do anything, and some of it is very distribution-specific. And Red Hat includes two of the three ways, so I found myself editing two competing config files. I finally figured it all out, but is was a pain.
I came across this little KDE app and found that it greatly simplified getting it all working, especially if I want to change the setup to use different access points. It mimics the Windows app that comes with the wavelan cards. It also includes a cool little signal strength meter which docks into KDE's panel (again, like the one in the system tray on Windows).
I found the app from Jean Tourrilhes' WaveLAN page. If you don't have KDE, then look for the GNOME or E one I guess.
Oh yeah: One wrinkle I found was that the only way to get past those "network unreachable" errors was to hard-code a gateway IP in /etc/sysconfig/network. I was hoping DHCP would set that up, but I guess not (I may have DHCPCD configured wrong, though). I'm probably going to make a tiny shell script or something that changes the wavelan preset and that file at once.
We had an earthquake in San Diego at about 11:55 pm on October 30th, 2001. It was a 5.1 magnitude, and the epicenter was in Anza, CA. I felt it quite a bit. The water in my glass visibly moved, and my computer monitor shook noticeably. It went on for quite a while, but I can't guess exactly how long it was. According to some seismograms I found, it lasted for over a minute. It was fairly disturbing, but also intersting at the same time. However, I probably would have felt better if I had been on the ground floor of my house.
I decided to save the seismograms I found, since they update automatically. If I didn't save them then the "snapshot" would be lost. They are from University of Arizona's seismometers. I added an explanation of what each graph is.
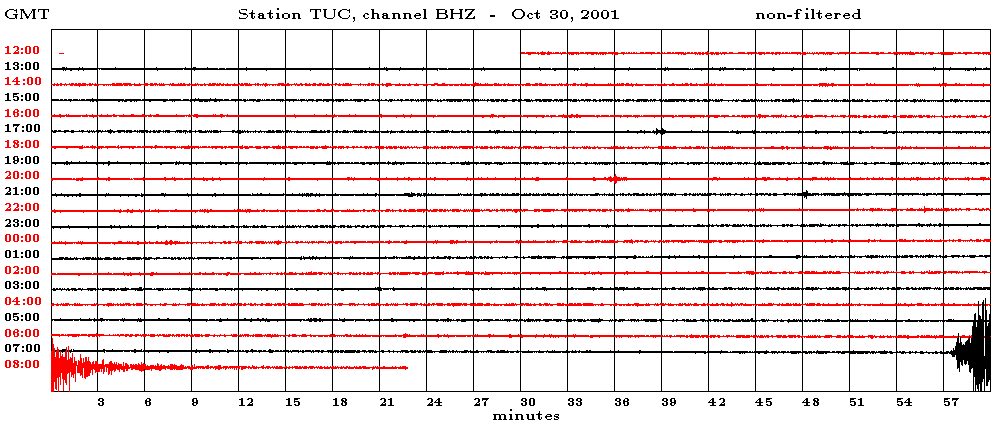
This displays the broadband vertical data. This is basically a "recording" of all the frequencies "heard" by the seismometers. The typical range for earthquakes is 50 Hz to 0.001 Hz. The frequencies are measured by their period, with one second being 1
Hz.
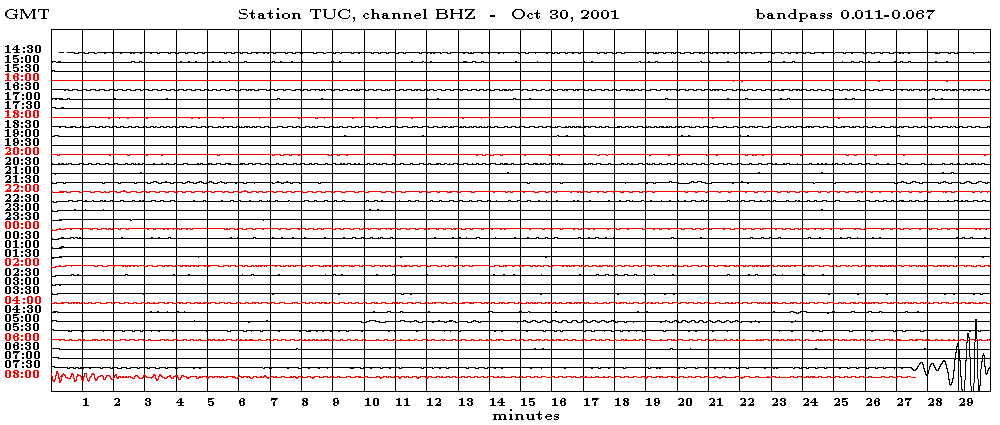
This displays the long-period data which will clearly display large (magnitude greater than 5.5) earthquakes. The long period waves are those with periods greater than 10 seconds -- the powerful ones. This graph will show the really big quakes very well since all the short period (or high frequency) stuff is filtered out. You don't want to be around when there's a big squiggle being recorded
on this graph...
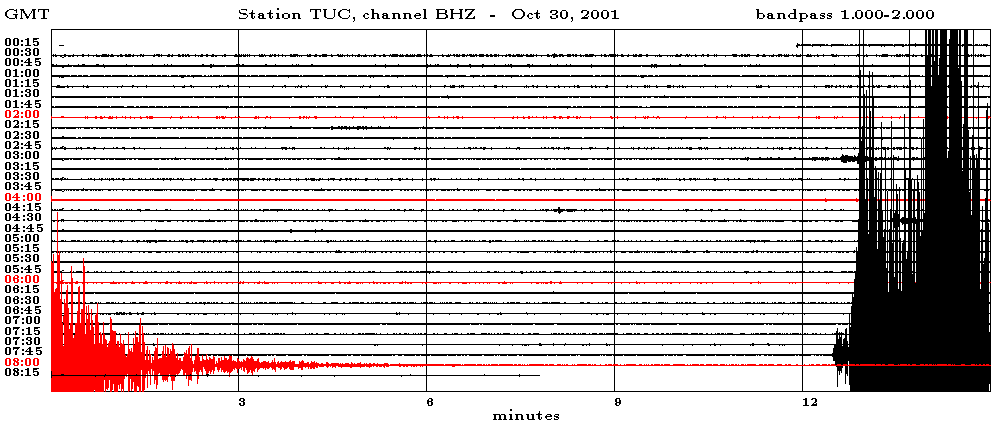
This displays the high-frequency (short-period) data. This will also record mining activity, underground nuclear testing, and the like very well.
That's all I could find from UofA. If I still lived near the Gould-Simpson building, I'd be able to go in tomorrow morning and grab a real paper seismogram. I used to have one from the Northridge quake and one which showed a Soviet underground nuclear test taped to my fridge.
I nabbed some really cool maps from TriNet.
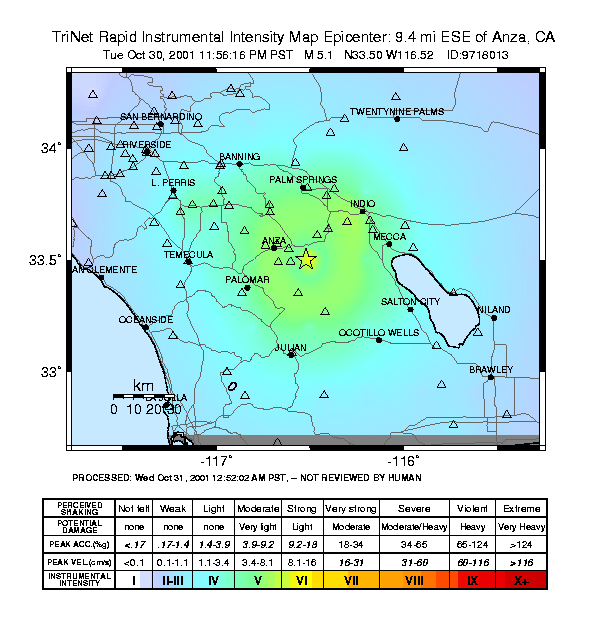
Intensity: This is an intensity map. I think it's purpose is to show people how far from the epicenter (which is the yellow star) a quake could be felt. So it's basically a Mercalli Scale map I guess.
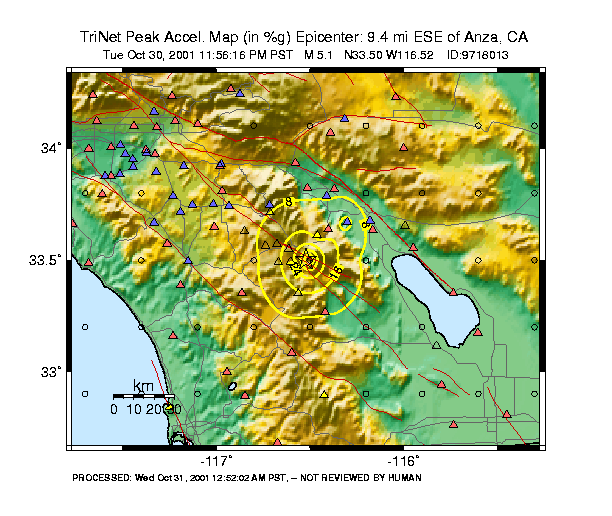
Peak Ground Acceleration: This shows how much the ground accelerated in the area near the quake. The more acceleration, the bigger the quake (and worse it is, naturally).
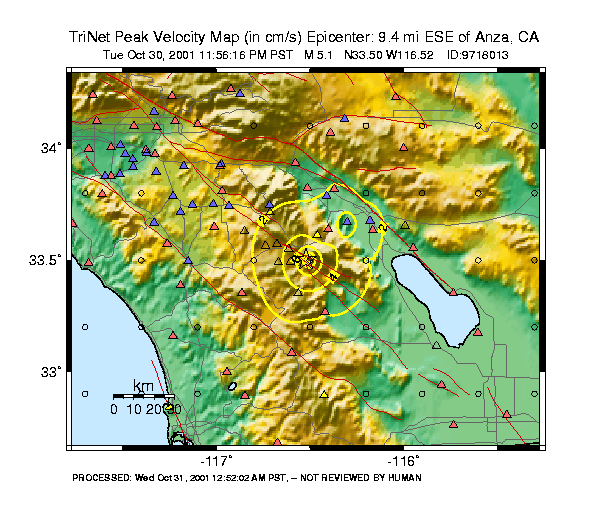
Peak Ground Velocity: A map of how fast the ground was moving. Like the map above, the more it was moving, the more intense the earthquake.
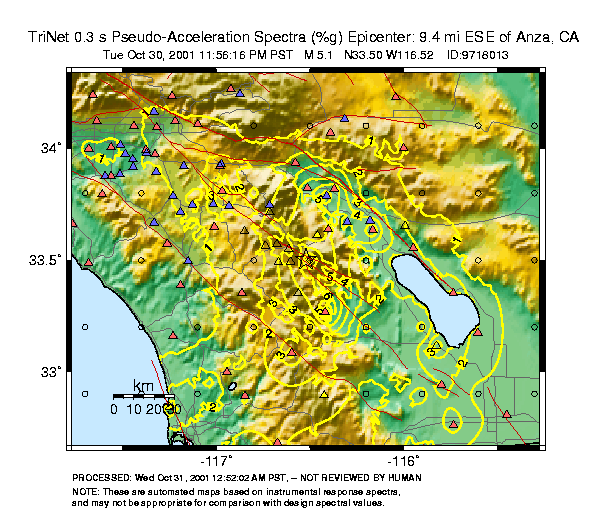
Spectral Response: Honestly, I've got no idea. I'll go look it up online, but I included the map now because I thought it looked pretty cool.
The last thing I nabbed of the TriNet site was a guide for newscasters. It has the specific stuff about this quake, and it's incredibly funny.
Chris Grout (a coworker) found some info about the quake on the Caltech USGS web site. Their site was overloaded, so I could only get to one map.
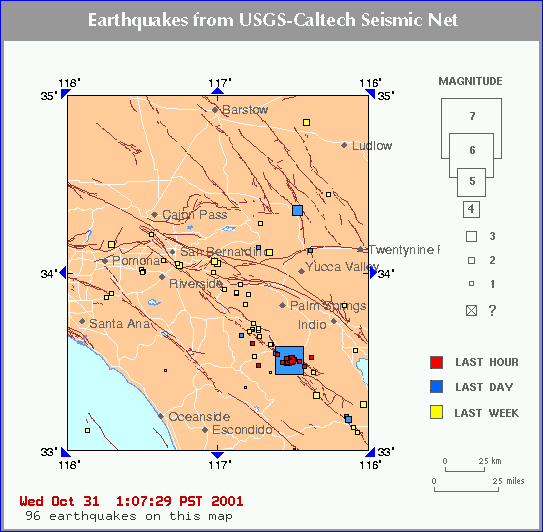
This is a map of all the earthquakes recorded for a certain periods of time. The one I felt is the big blue square. The little red squares are likely aftershocks. You usually see either foreshocks or aftershocks in little swarms like that. For reference, my house is about 15 miles south of Escondido.